
The Delaware-Maryland 4R Alliance posted two articles recently on its Facebook page related to 4R tools and technologies.
The first post links to a Delmarva Farmer article about University of Delaware Agronomist Jarrod Miller exploring potential applications of unmanned aerial vehicles (UAVs, or drones) in agriculture. Miller talks about how he’s working with drones to identify potential agronomic uses that will justify the cost to the farmer. “Part of our goal” he says, “is learn the basics and tell people what we learned. Maybe they can figure out ways to use it better for their own operation.”
The second post links to an article in Crops & Soils Magazine by Sally Flis, Director of Agronomy for The Fertilizer Institute, discussing the need and potential options to improve the links between nutrient source, placement and timing in order to make better recommendations on nitrogen rate. The article talks about two common frameworks to develop nitrogen recommendations, as well as up-and-coming tools and approaches to better integrate nitrogen source, timing and placement decisions with the right N rate. The article points out how “Further research is needed on the impact of combining source, rate, time, and placement changes in a single experiment and their impact on [Nitrogen Recover Efficiency, or] NRE.”
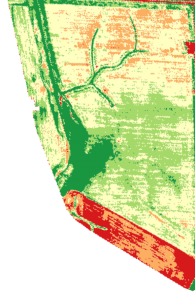
The first field in the DM4RA’s 2017 demonstration shows a light green area in the field that reflects where nitrogen carried over from the previous crop.
In 2017, the DM4RA worked with Hoober and two Delmarva farmers on a demonstration project, using a drone to help inform in-season nitrogen application decisions. In the project, a drone captured NDVI data on corn fields when the farmer was getting ready to make a sidedress nitrogen application. NDVI, or “normalized difference vegetation index” is essentially a measure of crop vigor. It’s the same kind of data that’s used in optical sensors like Greenseeker and OptRx to determine nitrogen sidedress rates on-the-go. In this case, the NDVI data was used to create a map of the crop fields, and delineate different management areas in the field. How the data was used to inform nitrogen application rates differed between the two fields.
In the first field, the corn followed a spinach crop from the previous year in a portion of the field. The spinach crop was assumed to have taken up all of the nitrogen that was applied, without any nitrogen carrying over into the 2017 crop year. The original recommended N rate for the field was a variable-rate prescription based on previous years’ yields. The NDVI data, however, indicated that corn growing in the portion of the field had a higher NDVI relative to other parts of the field, indicating that there was some N carryover from the previous year that supported vigorous early growth and development. With that knowledge, it was possible to reduce the N application rate in that part of the field, assuming that some of the N requirement of the corn was met by N carried over from the previous crop.
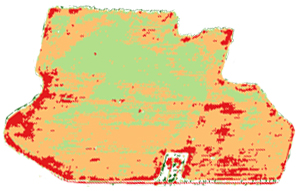
In the second field, the light green area represents a portion of the field with higher yield potential than the orange and red areas of the field.
In the second field, the drone was flown too early in the season for us to base N application rates on the NDVI data with sufficient confidence. In that field, we simply compared the NDVI data that was taken early in the season to the harvest data, to see if there appeared to be a correlation between the two. In this case, even early in the season, the NDVI data did seem to match up with different areas in the field with high and low yield potential. In future years, the farmer might use this data to delineate different management areas in the field to adjust N application rates according to crop yield potential.
What these two demonstrations showed is that there is potential to use NDVI data to help inform N application decisions. In the first field, data from the drone helped to identify an area where available nitrogen existed that would not have been previously accounted for. In the second field, NDVI data helped to identify areas in the field with high and low yield potential. The NDVI data reflects conditions within the current season that impact 4R management decisions and can result in more accurate N application rates.
In both cases, however, NDVI data collected from the drone did not translate directly into a sidedress N application rate. (This is different than active optical sensors that are mounted on a sprayer and use an algorithm to calculate the right N rate on the fly.) In the first field, for example, the NDVI data did not quantify how much N was left over from the previous crop that could be subtracted from the current application rate. In the second field, it isn’t clear from the data how much the N application rate should vary between the areas of the field with low yield potential versus high yield potential. The NDVI data is helpful to guide application rates in combination with agronomic expertise and familiarity with the field. These informed decisions may improve economic and environmental outcomes compared to a flat-rate application strategy, if they’re a part of an overall management strategy that looks at multiple factors that can impact yield potential (such as pH, other nutrient deficiencies and drainage concerns) and allows for flexibility to address in-season conditions (such as split N applications).
The conclusion of the article in Crops and Soils says that “the influence of weather, soil, and other conservation practices on yield and efficiency measures like NRE needs further consideration in the advancement of nitrogen recommendation systems.” Drones certainly have the potential to be one tool in that toolbox.


